⚙️ 동기
가용되는 서버들이 많아 서버들의 리소스 확인 및 서버다운 확인 필요성을 느꼈다.
서버들의 CPU, RAM, DISK를 모니터링을 하면서 CPU, RAM, DISK 각각 일정 %를 넘으면 알림을 주고, 서버가 다운이 되면 알림을 주도록 구현.
🛠️ 사용한 Tools.
서버모니터링 | Grafana
메트릭 정보 저장 | Prometheus
서버 CPU, Memory, Disk 정보 제공 | node exporter
알림 제공 | alertmanager(Prometheus, Telegram)
sudo yum install -y https://dl.grafana.com/oss/release/grafana-11.0.0-1.x86_64.rpm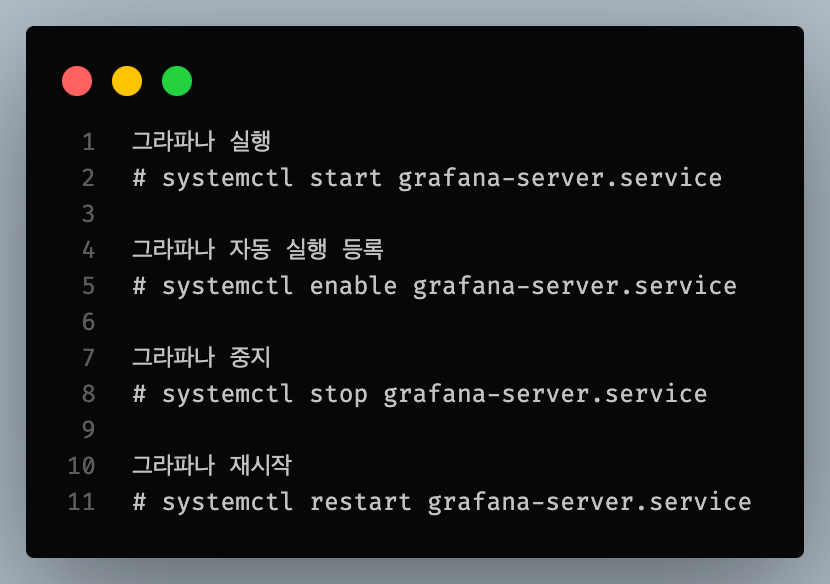
Grafana 방화벽 열기
3000 port 방화벽 open
# firewall-cmd --zone=public --permanent --add-port=3000/tcp
# firewall-cmd --reload
# firewall-cmd --zone=public --list-all
Grafana 접속
http://localhost:3000/login에 접속하면 Grafana에 접속할 수 있다.
prometheus 설치
prometheus 설치
wget https://github.com/prometheus/prometheus/releases/download/v2.42.0/prometheus-2.42.0.linux-amd64.tar.gzprometheus 압축풀기
tar -xzvf prometheus-2.42.0.linux-amd64.tar.gzprometheus 실행
./prometheus --config.file=/파일경로/prometheus.ymlprometheus 접속
프로메테우스 default 포트 : 9090
http://localhost:9090
prometheus.yml 파일설정
# my global config
global:
  scrape_interval: 15s # Set the scrape interval to every 15 seconds. Default is every 1 minute.
  evaluation_interval: 15s # Evaluate rules every 15 seconds. The default is every 1 minute.
  # scrape_timeout is set to the global default (10s).

# Alertmanager configuration
alerting:
  alertmanagers:
    - static_configs:
        - targets: ["localhost:9093"]
          # - alertmanager:9093
# Load rules once and periodically evaluate them according to the global 'evaluation_interval'.
rule_files: ["alert.rules.yml"]
  # - "first_rules.yml"
  # - "second_rules.yml"
# A scrape configuration containing exactly one endpoint to scrape:
# Here it's Prometheus itself.
scrape_configs:
  # The job name is added as a label `job=<job_name>` to any timeseries scraped from this config.
  - job_name: "node"
    # metrics_path defaults to '/metrics'
    # scheme defaults to 'http'.
    static_configs:
     - targets: ["ip:9100"]
node exporter 설치 및 압축풀기
# node_exporter 설치.
wget https://github.com/prometheus/node_exporter/releases/download/v1.7.0/node_exporter-1.7.0.linux-amd64.tar.gz

# 파일 압출 풀기.
tar xzvf node_exporter-1.7.0.linux-amd64.tar.gz
node_exporter 실행
./node_exporter

# 백그라운드 실행
./node_exporter &
🧱 Grafana를 이용해서 서버 리소스 알림

이렇게 Grafana에 접속한 후,
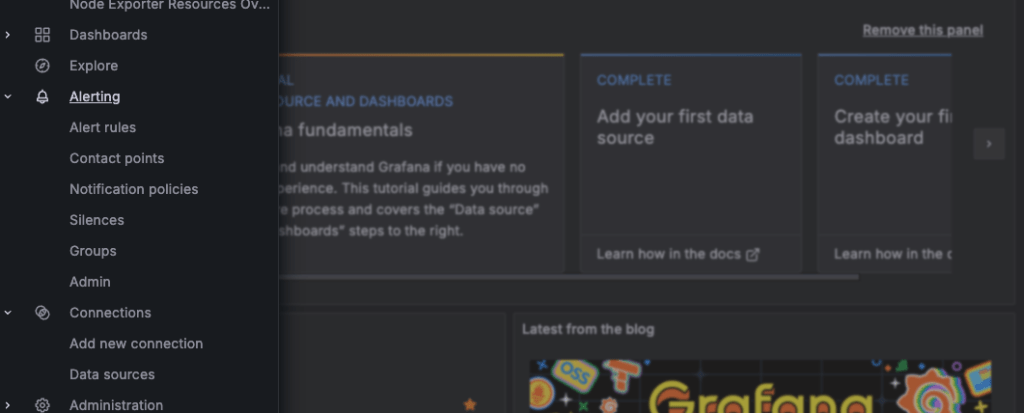
alerting에 들어간다.
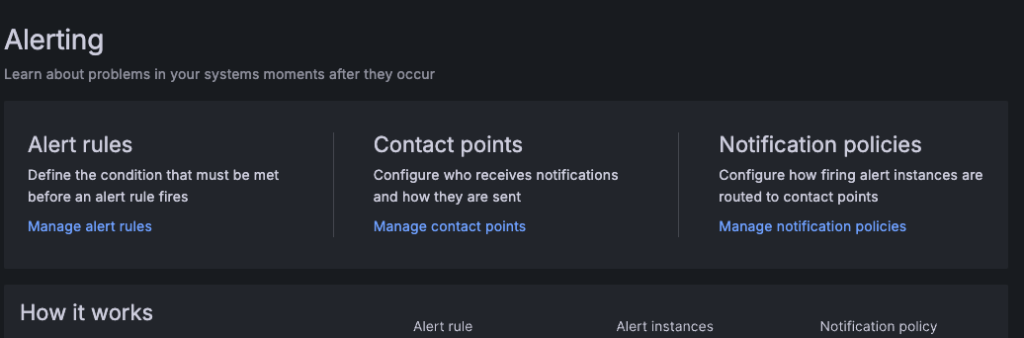
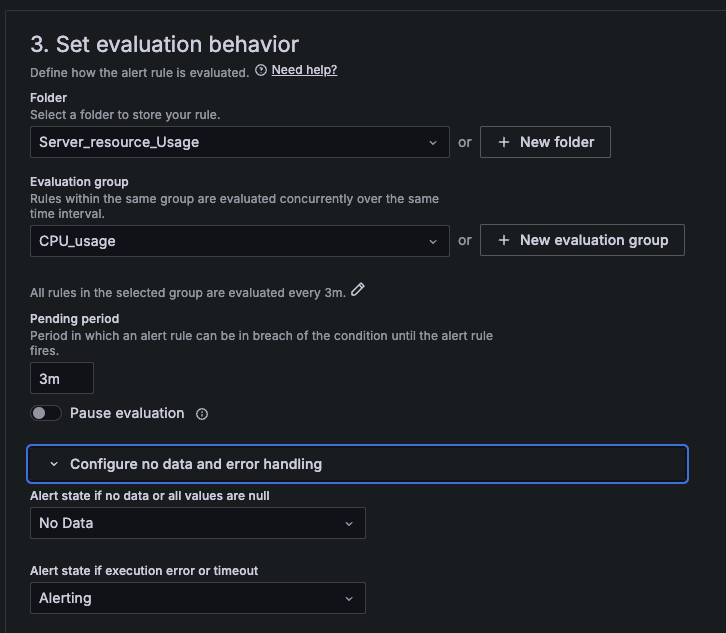
alerting에 3가지가 나오는데, 먼저 alert rules를 작성해야 한다.
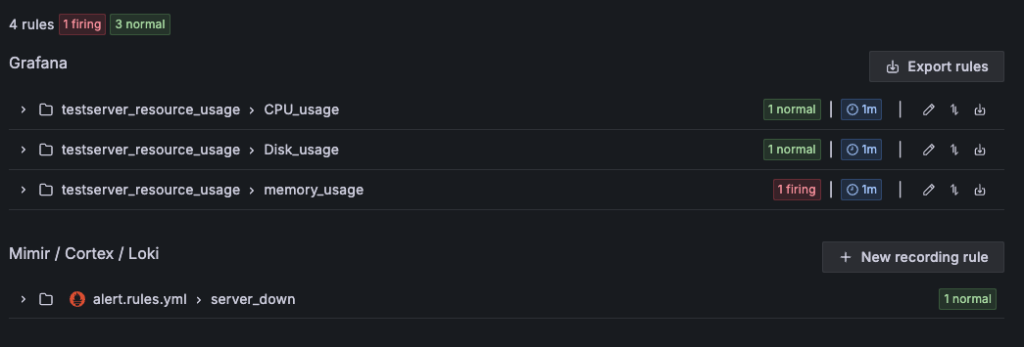
나는 CPU, Disk, RAM 이렇게 3가지를 모니터링을 할 것이다.
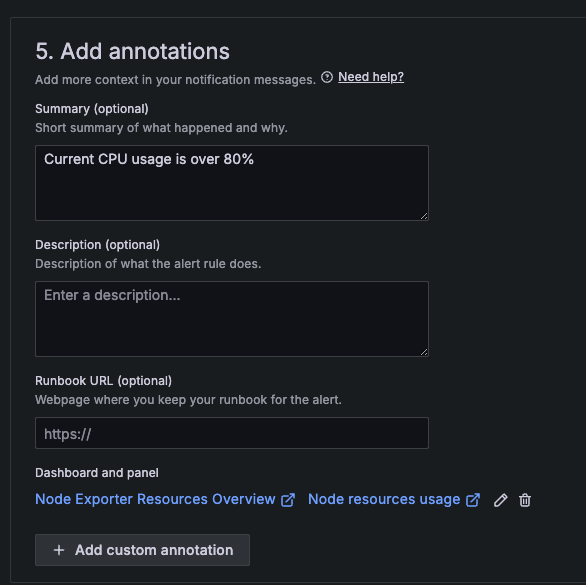
CPU 설정법

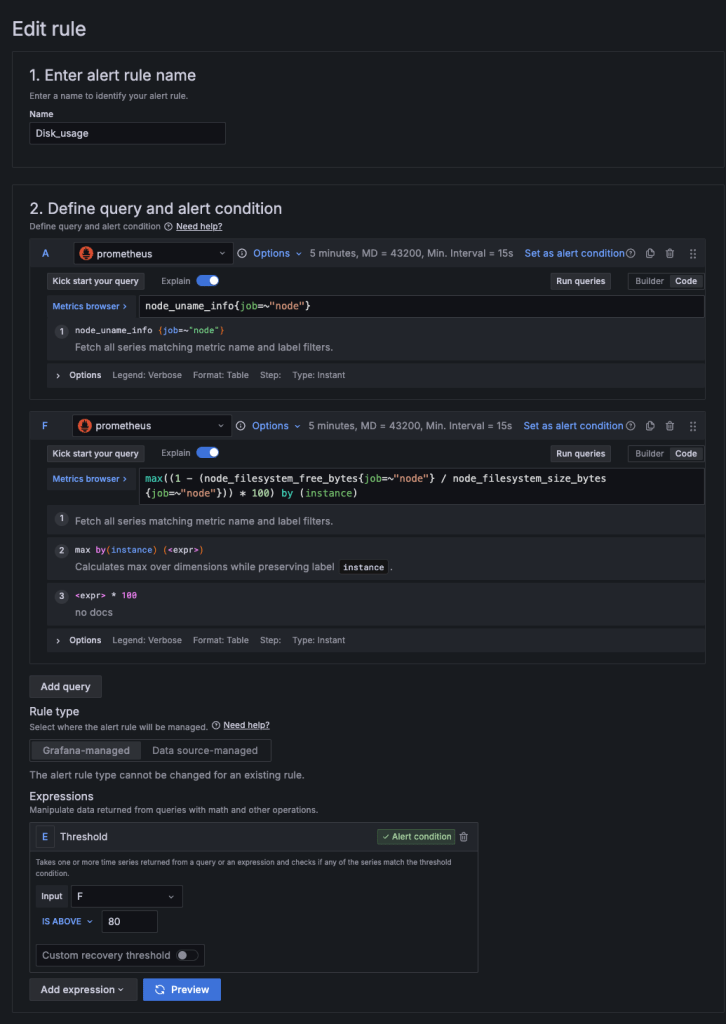
DISK 설정법
RAM 설정법
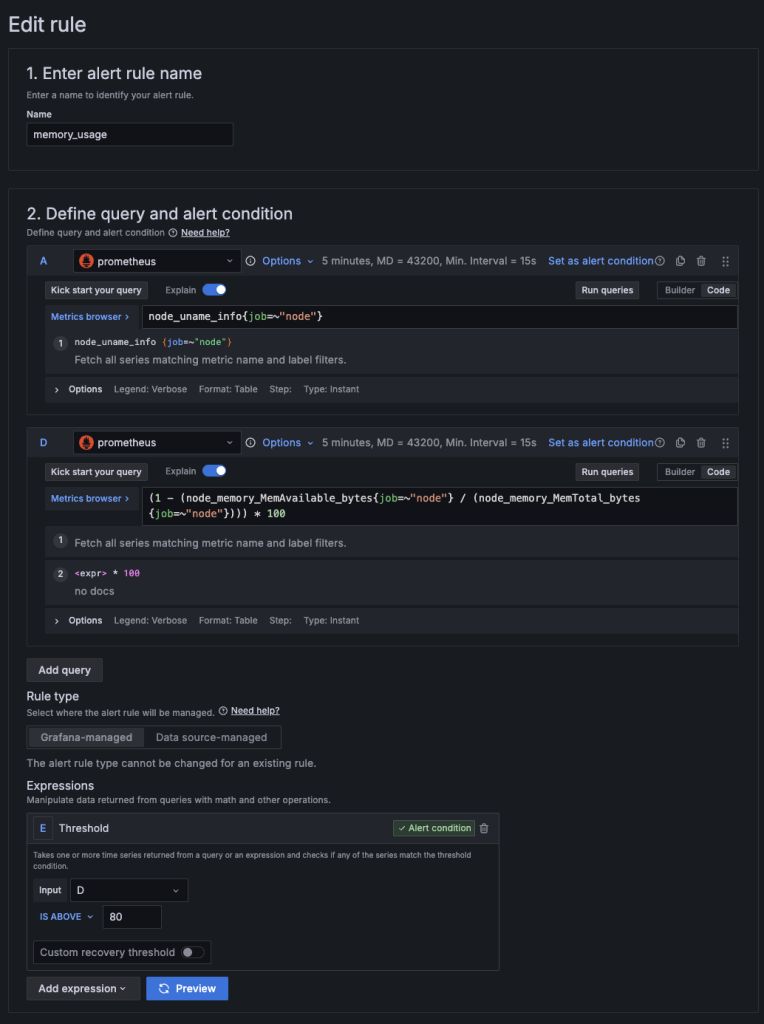
나머지는 CPU 설정법과 동일하다. 이미지 보고 참고 바란다.
contact Points 에서 Telegram 사용
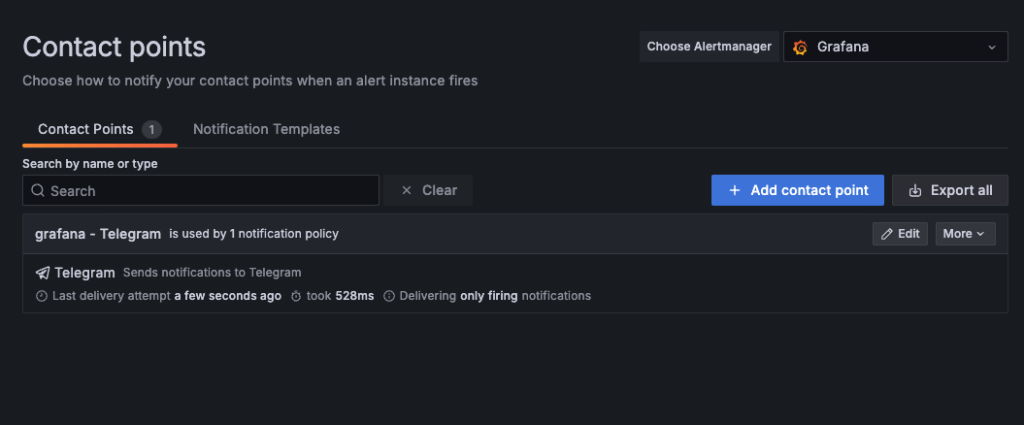
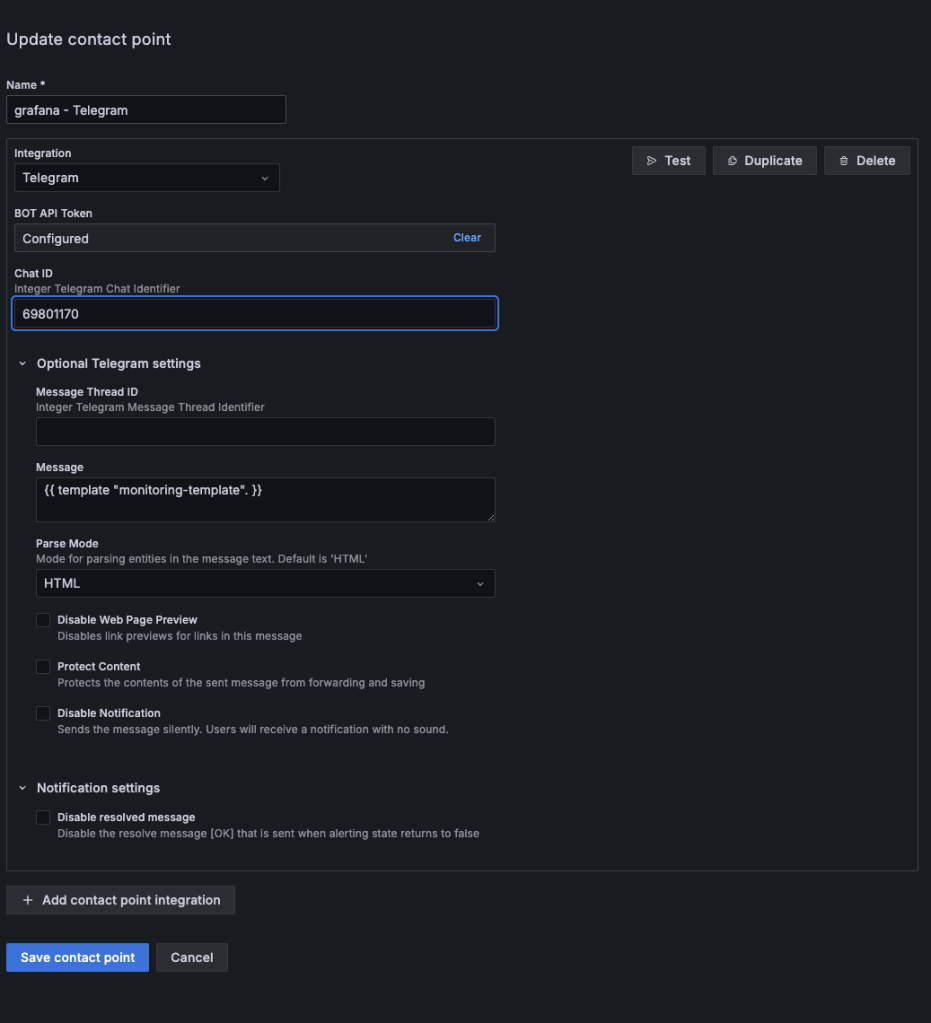
이렇게 텔레그램으로 알림을 줄 수 있게 만들어 주면 된다.
Notification Templates 설정
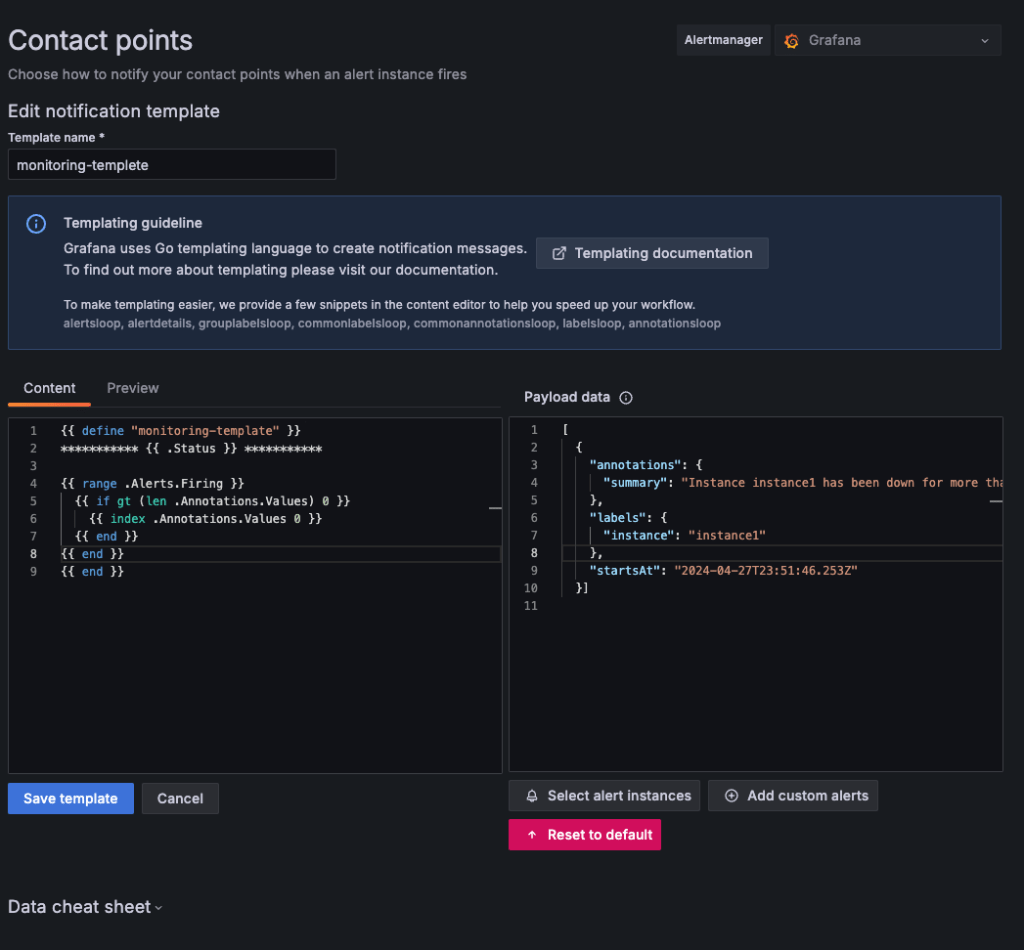
template 제목
monitoring-templetetemplate 코드
{{ define "monitoring-template" }}
*********** {{ .Status }} ***********

{{ range $key, $value := .CommonLabels }}
  {{$key}}: {{$value}}
{{ end }}
{{ range .Alerts.Firing }}
  {{ if gt (len .Annotations) 0 }}
    {{ index .Annotations.Values 0 }}
  {{ end }}
{{ end }}
{{ end }}

# 자신의 쓸 알람 스타일에 맞게 변형해서 쓰면 된다.
alertmanager 설치 및 실행
- (port : 9093)
Alertmanager는 Prometheus의 오픈 소스 알림 관리 시스템
telegram_config를 사용하려면 버전을 0.27.0버전 이상 사용해야 함.
1. alertmanager 설치.
wget https://github.com/prometheus/alertmanager/releases/download/v0.27.0/alertmanager-0.27.0.linux-amd64.tar.gz

2. 압축 풀기.
tar -xzf alertmanager-0.27.0.linux-amd64.tar.gz
alert.rules.yml 설정
instance 서버가 다운이 되면 알림을 주는 녀석이다.
이 파일은 Prometheus 디렉토리에 저장하면 된다.
groups:
- name: server_down
  rules:
  - alert: InstanceDown
    expr: up == 0
    for: 1m
    labels:
      severity: critical
    annotations:
      summary: "Instance {{ $labels.instance }} down"
      description: "{{ $labels.instance }} of job {{ $labels.job }} is down."
alertmanager.yml 설정
# 디폴트 내용

#route:
#  group_by: ['alertname']
#  group_wait: 30s
#  group_interval: 5m
#  repeat_interval: 1h
#  receiver: 'web.hook'
#receivers:
#  - name: 'web.hook'
#    webhook_configs:
#      - url: 'http://127.0.0.1:5001/'
#inhibit_rules:
#  - source_match:
#      severity: 'critical'
#    target_match:
#      severity: 'warning'
#    equal: ['alertname', 'dev', 'instance']
# 텔레그램 설정
global:
resolve_timeout: 5m
route:
group_by: ['alertname', 'instanceDown']
group_wait: 20s
group_interval: 2m
repeat_interval: 1m
receiver: 'telegram'
receivers:
- name: 'telegram'
telegram_configs:
- bot_token: '텔레그램 봇 토큰'
chat_id: 챗 IDalertmanager 재시작
./alertmanager &